How to Use Visualization Tools in the Gas Industry
February 13, 2023
The Gas Industry and Data Visualization Tools
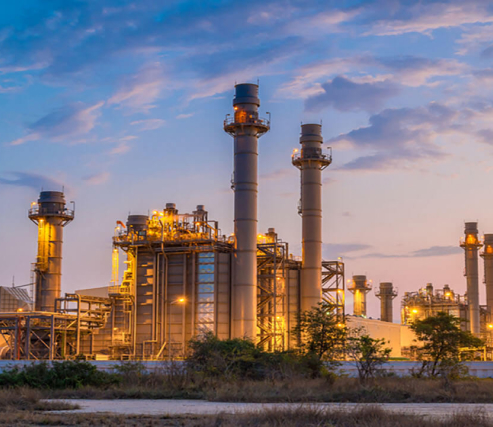
The gas industry is a vital sector that plays a critical role in powering homes, industries, and vehicles across the globe. The industry is constantly evolving, with new technologies and advancements emerging regularly. To keep up with these changes and make informed decisions, it is essential to leverage data and visualization tools. In this article, we will explore how gas industry professionals can use visualization tools to gain valuable insights and make data-driven decisions.
Why Visualization Tools Matter in the Gas Industry
In the gas industry, huge amounts of imported data are generated every day from a wide range of varied and disparate data sources. From production and consumption to safety and compliance, data is at the core of every aspect of the industry. However, it is challenging to make sense of this data without effective tools for data visualization.
Visualization tools can help gas industry professionals understand complex data sets, identify trends, and gain insights quickly. Data analytics visualization tools help to transform data into meaningful and easily understandable visualizations; these analytics tools include features that make it easier to spot patterns and make informed decisions.
Visualizations also help to improve communication within the industry. They make it easier to share information and insights with stakeholders, including management, customers, and regulators–all of which are part of business intelligence leading to actionable insights.
Types of Visualization Tools in the Gas Industry
There are several types of data visualization software that gas industry professionals can use to gain insights and make data-driven decisions. Here are some of the most common ones:
Geographic Information Systems (GIS): GIS tools enable the visualization of data on maps. This includes information on gas pipelines, storage facilities, production sites, and other gas-related infrastructure. GIS tools help to identify potential issues or bottlenecks in the gas supply chain and make informed decisions.
Dashboards: Dashboards provide an overview of key performance indicators (KPIs) and other relevant data in real time. This includes data on gas production, consumption, and reserves, as well as safety and compliance metrics. Dashboards allow gas industry professionals to monitor performance and identify trends quickly, creating visual interpretations of data. .
3D Visualization: 3D visualization tools help gas industry professionals visualize gas infrastructure, including pipelines and storage tanks, in three dimensions. This allows for better planning and analysis of gas infrastructure projects.
Machine Learning (ML) and Artificial Intelligence (AI) Tools: ML and AI tools can help identify patterns in large data sets and make predictions about future trends. These tools can be used to identify potential issues before they occur and optimize gas production and distribution
Types of Visualization Tools in the Gas Industry
The benefits of using visualization tools in the gas industry are numerous. Some of the key advantages include:
Improved Decision-Making: Visualization tools provide gas industry professionals with valuable insights that can inform decision-making. This includes identifying trends, predicting future outcomes, and highlighting potential issues.
Enhanced Safety: Visualization tools can help gas industry professionals identify safety risks and take corrective action before accidents occur. This includes monitoring gas pipelines, storage facilities, and other infrastructure for potential issues.
Increased Efficiency: Visualization tools allow industry professionals to optimize gas production and distribution, reducing waste and improving efficiency. This includes identifying areas where production can be increased and reducing the time needed to identify and resolve issues.
Improved Communication: Visualization tools make it easier to share information and insights with stakeholders. This includes sharing data with management, customers, and regulators, as well as collaborating with other professionals in the industry.
Takeaways
The gas industry is constantly evolving, and visualization tools are an essential component of staying ahead of the curve. By leveraging these tools, gas industry professionals can gain valuable insights, improve decision-making, and increase safety and efficiency. With the right visualization tools, gas industry professionals can make informed decisions that drive success and help to power the world.