How 3D Data Visualization Solutions Transform Your Business

February 27, 2023

How 3D Data Visualization Solutions Can Transform Your Business

In today’s business world, data visualization is essential for making informed decisions. While two-dimensional (2D) visualizations have been the norm, the rise of three-dimensional (3D) data visualization solutions is now transforming the way businesses make sense of their data. Here we’ll explore the benefits of 3D data visualization software and solutions and why they are becoming increasingly popular.

Where is 3D visualization used?

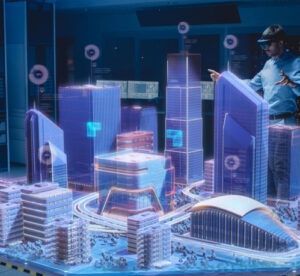
3D data visualization tools are used in a wide range of industries, including healthcare, manufacturing, architecture, engineering, construction, and finance. For example, in healthcare, 3D imaging is used to visualize the human body in a more accurate and detailed way. In manufacturing and engineering, 3D visualization is used to create 3D models of products and machinery to improve production efficiency. In finance, 3D visualization is used to represent financial data in a more intuitive and easy-to-understand way.

How do you represent data in 3D?

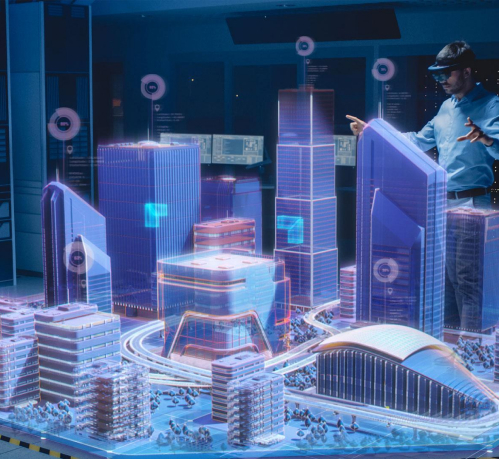
Representing data in 3D involves creating a three-dimensional space with data points plotted in that space. This is typically done using software that allows users to manipulate the data and view it from different angles through computer-generated imagery. Some 3D visualization tools also allow users to add animations and interactive elements to the visualization, which can provide even more insights.

In architecture and interior design, for example, this can be done through 3D software like Point Clouds, BIM, 360 Images, and architectural visualizers.

What are the advantages of 3D data visualizations as opposed to 2D?

There are several advantages of using 3D data visualizations as opposed to 2D:

  • Better spatial representation: 3D graphics and 3D renderings provide a more accurate and intuitive representation of spatial relationships between data points. This is particularly useful when working with complex data sets that involve multiple variables.
  • Increased engagement: 3D visualizations are more engaging and interactive than 2D visualizations, making it easier for users to explore and understand the data. This can lead to more insights and better decision-making.
  • Improved communication: 3D visualizations are often easier to communicate to non-experts, such as stakeholders or clients. This is because 3D visualizations provide a more realistic and intuitive representation of the data, making it easier to explain complex ideas.
  • Better insights: 3D visualizations can help users identify patterns and trends that may be difficult to see in 2D visualizations. This is because 3D visualizations provide a more complete view of the data, allowing users to see relationships that may be hidden in 2D visualizations.
image 67
How Can 3D Visualization Transform Your Business?

3D visualizations can transform your business in several ways which can lead to better business intelligence, lay the groundwork for better product design, expand the horizons of data science, and much more. Here are some real-life examples:

  1. Better understanding of complex data: 3D visualizations can help you better understand complex data sets that involve multiple variables. By providing a more intuitive and accurate representation of spatial relationships between data points, 3D visualizations can help you identify patterns and trends that may be difficult to see in 2D visualizations.Data analysis through 3D visualization is accurate and understandable.
  2. Improved collaboration: 3D visualizations can be shared with team members or clients, making it easier for them to understand and engage with the data. This can lead to better collaboration and more informed decision-making.
    Increased efficiency: 3D visualizations can help you identify inefficiencies in your business processes by visualizing data in a way that highlights areas for improvement. By identifying areas that need attention, you can make changes that increase efficiency and reduce costs.
  3. Enhanced marketing and communication: 3D visualizations can be used to create compelling marketing materials that showcase your products or services. By providing a more realistic and interactive representation of your offerings, you can better communicate their value to potential customers.
  4. Improved training and education: 3D visualizations can be used to create interactive training and educational materials that help employees learn complex processes or concepts. This can lead to faster onboarding and increased productivity.

Overall, 3D visualizations can transform your business by providing a more accurate, engaging, and intuitive representation of data. Whether you work in healthcare, manufacturing, engineering, or finance, 3D data visualization solutions can provide valuable insights and help you make more informed decisions.

What Are 3D Data Visualization Examples in the AEC Industry?
  1. Design visualization: 3D visualization is used to create realistic and detailed visualizations of building designs. By creating 3D models of buildings and structures, architects and designers can better understand the spatial relationships between different elements and test different design ideas.
  2. Virtual walkthroughs: 3D visualization is used to create virtual walkthroughs of buildings and structures. This allows architects and clients to visualize the finished product before construction begins, and make any necessary changes before construction begins.
    Construction planning and scheduling: 3D visualization is used to create detailed construction plans and schedules. By visualizing the construction process in 3D, project managers can identify potential issues before they occur and optimize the construction schedule for efficiency.
  3. Safety planning: 3D visualization is used to create safety plans for construction sites. By visualizing the construction site in 3D, safety managers can identify potential hazards and create safety plans that mitigate risk for workers.
  4. Marketing and sales: 3D visualization is used to create realistic and engaging marketing materials for buildings and structures. By creating 3D visualizations of the finished product, developers and real estate agents can showcase the building or structure to potential buyers or tenants, providing a more realistic and engaging representation of the finished product.
Takeaways

In conclusion, 3D data visualization solutions can transform the way businesses make sense of their data. By providing a more accurate, engaging, and intuitive representation of data, 3D visualizations can help users identify patterns and trends that may be difficult to see in 2D visualizations. Whether you work in healthcare, manufacturing, engineering, or finance, 3D data visualization solutions can provide valuable insights and help you make more informed decisions.